
Modified Starch Solutions for Shear Resistance
Plan for the texture your product needs after processing. Explore starch selection for mixing, pumping and homogenization, matched to your formulation, equipment and final consistency target.
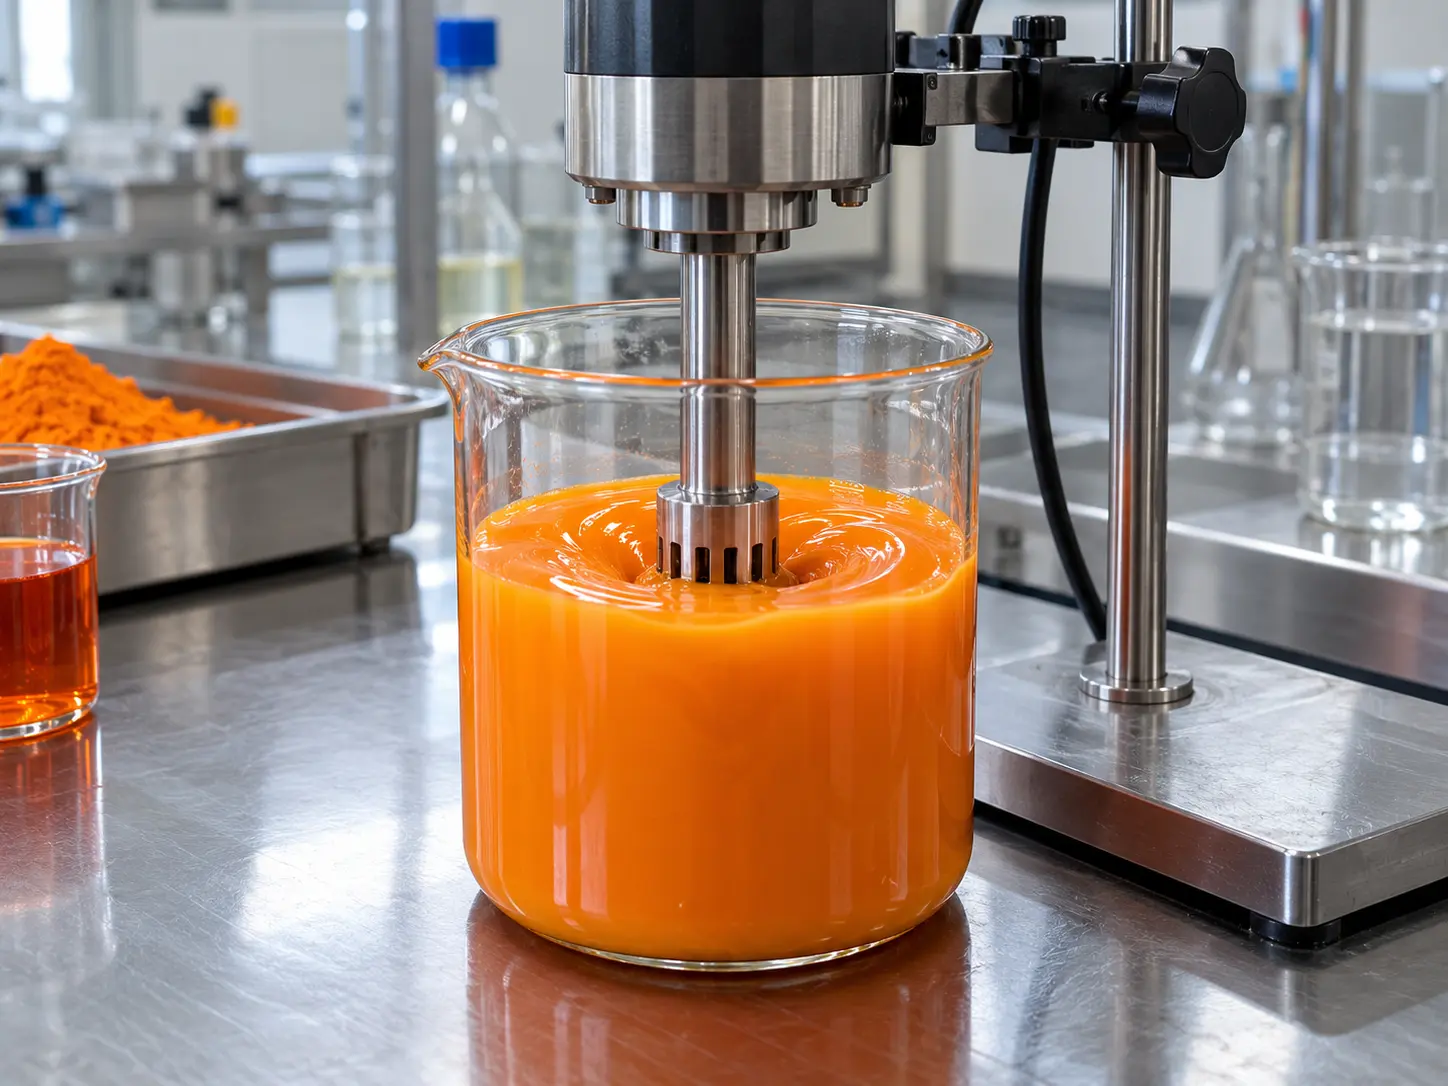
Is Processing Changing Your Product’s Consistency?
Identify the change, the step where it appears and the conditions used to measure it. Similar-looking results may need different adjustments.
Thinning During Mixing
Record temperature, duration, mixer type and batch conditions. Compare samples after consistent conditioning.
Different Body After Pumping
Check flow, coating and viscosity before and after pumping. Define sampling points, circulation and any temperature changes.
Texture Changes After Homogenization
Review the actual settings and product state. In emulsions, distinguish changes in droplets from changes in the starch-containing phase.
Bench and Production Results Differ
Compare equipment, preparation sequence, thermal history and mechanical exposure before changing the starch grade or dose.
Understand Shear Thinning and Structural Change
A useful evaluation separates flow during shear from product quality after mechanical processing.
Viscosity Depends on Measurement Conditions
Define temperature, shear rate and sample history. Comparing readings taken under different conditions can obscure the actual process effect.
Shear Thinning Is Not a Damage Test
A decrease in apparent viscosity as shear rate rises does not, by itself, establish permanent damage.
Check the Product After Processing
Compare the initial product, the processed sample and the sample after a defined rest at consistent measurement conditions.
- 01Preparation
- 02Mechanical processing
- 03Defined rest
- 04Measurement
- 05Application check
Document whether mechanical processing occurs before, during or after starch cooking. Follow the preparation guidance for the specific grade.
Find Your Shear-Intensive Application
Use the application to identify the relevant product attributes and processing steps. Then test candidates in the complete recipe.

Sauces & Dressings
Compare flow and coating after mixing, emulsification and filling. Include the complete seasoning recipe and preparation sequence.
Explore dressing applications →
Soups & Prepared Meals
Assess the soup or thickened phase before and after pumping or circulation, using consistent sampling and measurement conditions.
Explore prepared dish applications →
Dairy Products & Desserts
Review the final texture in the complete dairy formulation. Record mechanical processing, temperature history and conditioning before evaluation.
Explore dairy applications →
Emulsions & Spray-Drying Feeds
Measure feed viscosity and emulsion properties separately. A change in droplet size alone does not identify starch damage.
Explore emulsification →Choose Starch Around Your Equipment and Process
Share your formulation, preparation and mechanical-processing conditions to help define a useful comparison.
Define the Mechanical Processing Conditions
| Selection factor | Information to share | Evaluation focus |
|---|---|---|
| Application | Product type, starch location and target texture | Relevant finished-product quality |
| Formulation | Starch dosage, pH, salt, sugar, fat and other ingredients | Performance in the complete recipe |
| Preparation | Hydration, cooking, ingredient order and temperature history | Consistent starch preparation |
| Mixing | Mixer geometry, rpm, time, vessel and batch size | Equipment-specific exposure |
| Pumping | Pump type, flow, circulation and relevant pipework | The actual transfer or circulation process |
| Homogenization | Equipment, pressure, passes and product temperature | Relevant homogenization conditions |
| Evaluation | Sampling point, rest time and measurement conditions | Comparable before/after results |
E1422 / Acetylated Distarch Adipate
Discuss specific grades against your recipe, preparation sequence and mechanical-processing requirements.
View E1422 product information →E1442 / Hydroxypropyl Distarch Phosphate
Review available grades, technical information and the trial conditions needed to assess your final texture.
View E1442 product information →Mixer rpm alone does not define shear exposure across different equipment. Homogenization pressure is not a universal shear-resistance rating. Evaluate the specific grade under your actual conditions.
Working with an emulsion or drying feed? Review emulsification, microencapsulation and E1450 product information alongside the complete system.
Tianjiang’s Guide to Shear Resistance Evaluation
Use defined flow and shear-history comparisons to plan process-specific testing. Select measurements that answer your actual product question.
Compare Flow Behavior Under Defined Shear
10% pigeon pea starch systems; 1–1000 s⁻¹ shear-rate sweep. Herschel–Bulkley fitted parameters:
| Sample | Yield stress τ₀ (Pa) | Flow index n |
|---|---|---|
| Native pigeon pea | 84.15 ± 0.31 | 0.85 ± 0.00 |
| Cross-linked pigeon pea | 5.73 ± 0.22 | 0.45 ± 0.00 |
| Hydroxypropylated pigeon pea | 86.65 ± 0.39 | 0.83 ± 0.00 |
Common 0–1 scale. ± terms appear in the table.
Read this as flow behaviorLower n does not by itself establish greater shear resistance.
Evaluate Shear-History Dependence
5% native starch pastes; measurement at 20°C; ascending/descending shear-rate scans across 0.1–600 s⁻¹.
| Native starch | Hysteresis area (Pa·s⁻¹) |
|---|---|
| Normal potato | 49,535 ± 2,496 |
| Waxy potato | 10,054 ± 547 |
| Normal corn | 7,208 ± 3,298 |
| Waxy corn | 5,503 ± 839 |
Common 0–50,000 Pa·s⁻¹ scale. ± terms appear in the table.
Keep the protocol in viewHysteresis area is not a recovery percentage or a pump-pass limit.
The panels use different materials and protocols; do not combine them into one ranking. These parameters are not process viscosity-retention results or Tianjiang grade specifications.
Verify Performance in Your Actual Process
| Test stage | Information to record | Comparison control |
|---|---|---|
| Before processing | Complete recipe, preparation method and initial product state | Same formulation and conditioning |
| During processing | Equipment, duration, temperature, speed or pressure and passes | Recorded actual operating conditions |
| Immediately after | Sampling location, time and product state | Consistent sampling and handling |
| After defined rest | Viscosity and texture at the specified rest time | Same temperature, shear conditions and method |
| Final application | Flow, coating, filling or eating characteristics | Intended use and serving conditions |
Use this calculation only with measured before/after values obtained at the same temperature, shear conditions and sample conditioning. Define sampling and rest time. A flow index or hysteresis area cannot replace these measurements.
From Processing Challenge to Application Trial
Share Your Process
Describe the application, equipment, current issue and known mechanical and thermal conditions.
Discuss Grade Options
Contact Tianjiang to review candidate grades, technical information and sample needs.
Evaluate in Your Production Conditions
Compare candidates in the actual formulation and process, then assess the final product against defined targets.
Shear-Resistant Starch: Frequently Asked Questions
What Does Shear Resistance Mean for Starch?
Define it around the required product quality after a specified mechanical process. Include the formulation, preparation, equipment, exposure time, temperature and measurement conditions.
Is Shear Thinning the Same as Permanent Breakdown?
No. Apparent viscosity can decrease as shear rate rises. A flow curve alone does not establish permanent damage; evaluate the sample after processing and after a defined rest under comparable measurement conditions.
Can Mixer Speed Define Shear Exposure?
Speed alone is insufficient. Record mixer geometry, vessel, batch volume, duration and temperature. The same rpm does not describe equivalent conditions across different equipment.
How Should Pumping and Homogenization Be Evaluated?
Record pump or homogenizer type, flow or pressure, passes, temperature and sampling points. Compare the actual product before and after the relevant step.
How Should Viscosity Retention Be Measured?
Use the same temperature, shear conditions and sample conditioning for the before/after readings. Define the sampling and rest time. Report the calculation basis with the measured values.
What Information Is Needed for a Recommendation?
Share the application, current starch and dosage, recipe, preparation sequence and equipment. Include processing temperature, duration, current issue and target texture.
Find the Right Starch for Your Processing Conditions
Tell us what you make and where consistency changes. Contact Tianjiang to discuss grade options, technical information and sample availability.
Prefer email? sales@tianjiangmodifiedstarch.com
Helpful Details for Your Enquiry
- Application and current consistency issue
- Current starch and dosage
- Mixing, pumping or homogenization equipment
- Processing temperature and duration
- Target texture and sample needs
Not sure of every parameter? Start with what you know.