
Modified Starch Solutions for Texture Improvement
Build the texture your product needs—from smooth, spoonable body to a softer gel or firmer bite. Explore starch selection matched to your formulation, processing conditions and storage requirements.
Is Your Product’s Texture Missing the Target?
Start with the eating or handling characteristic you want to change. Define the target before comparing starches.
Thin Body or Weak Structure
Sauces may lack coating, desserts may need more support or gels may not hold their shape. Evaluate flow, consistency and structural strength.
Sticky or Pasty Mouthfeel
Excessive stickiness, lingering paste or stringiness can affect acceptance. Review adhesiveness, starch dosage and preparation.
Excessive Firmness or Poor Bite
A product may be too hard, too chewy or insufficiently springy. Decide whether the goal is softness, elasticity or a firmer bite.
Texture Changes During Storage
Check for hardening, water separation and changes after reheating. Evaluate the food under actual storage and serving conditions.
Define Texture Beyond Viscosity
Use measurements and tasting together to describe the texture your product needs.
Control Body and Flow
Define pouring, spreading, coating and spooning behavior. Assess viscosity alongside the way the product is handled and served.
Balance Softness, Firmness and Elasticity
Set suitable ranges for hardness, springiness, cohesiveness and chewiness. The preferred balance depends on the food.
Evaluate Mouthfeel in the Finished Product
Use sensory evaluation for smoothness, creaminess, pastiness and stickiness. Instrumental measurements support these decisions.
- 01Target texture
- 02Formulation & process
- 03Instrumental testing
- 04Sensory evaluation
Texture Solutions for Different Food Applications
Match starch selection to the complete recipe and its required eating and handling characteristics.

Sauces, Dressings and Soups
Compare pouring, spreading and coating, alongside smoothness and pastiness at the intended serving temperature.
Explore dressing applications →
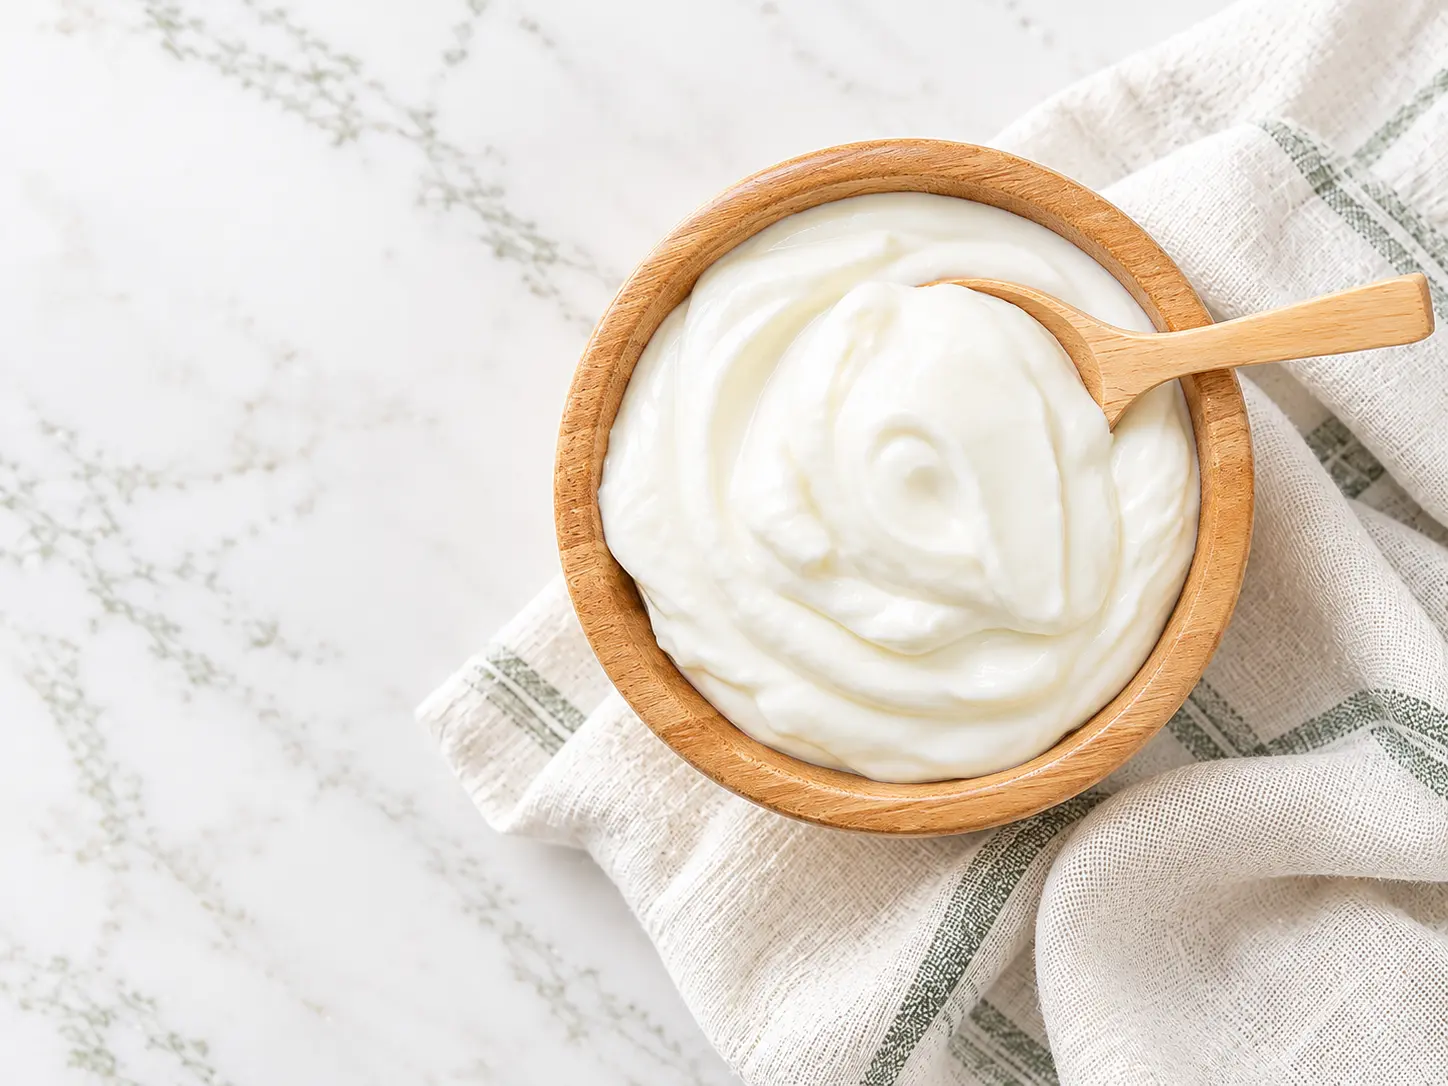
Dairy and Plant-Based Desserts
Define the desired spoonable body and softness. Assess the complete recipe after chilling and throughout storage.
Explore dairy applications →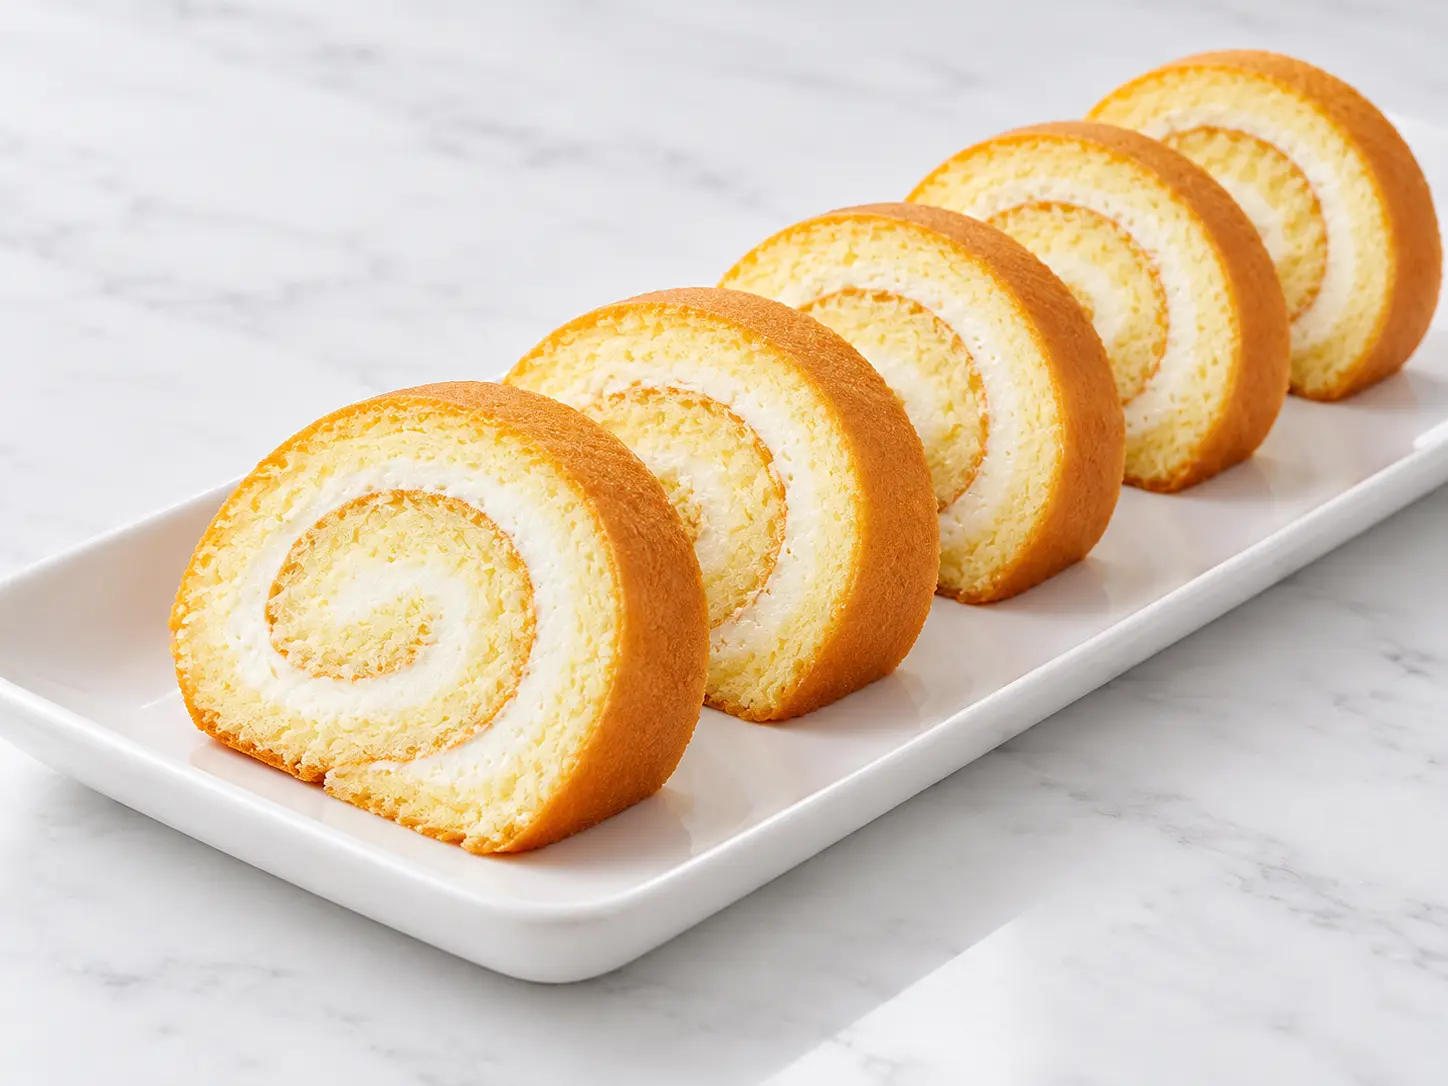
Bakery and Dessert Fillings
Evaluate piping or spreading, filling support and eating softness under the relevant baking and storage conditions.
Explore bakery applications →
Meat and Seafood Products
For formed or gelled products, compare hardness, springiness and chewiness in the actual protein, salt and water system.
Explore prepared food applications →Choose Starch Around Your Texture Target
Use your desired texture, ingredient system and processing conditions to define a useful grade comparison.
Match the Target to the Formulation
| Texture target | Evaluation focus | Conditions to confirm |
|---|---|---|
| Smooth, spoonable body | Flow, consistency and sensory smoothness | Fat, protein, sugar and serving temperature |
| Softer gels | Hardness, chewiness and changes during storage | Total starch, starch blend and cooling conditions |
| Firmer or springier bite | Hardness, springiness and cohesiveness | Protein, salt, water and heating process |
| Less sticky or pasty mouthfeel | Adhesiveness and sensory observations | Dosage, dispersion and starch preparation |
| Consistent texture during storage | Hardening, water separation and reheating response | Storage time, temperature and freeze-thaw exposure |
Acetylated Distarch Adipate — E1422
Discuss candidate grades against your texture target, formulation and processing conditions. Confirm the balance of product body and eating characteristics through trials.
Explore E1422 →Hydroxypropyl Distarch Phosphate — E1442
Compare specific grades for the required gel texture and performance after chilling or freezing, where relevant to the application.
Explore E1442 →Grades sharing the same E number can differ in starch source and modification level. Confirm suitability and dosage in your own formulation.
Tianjiang’s Guide to Texture Evaluation
Explore two model systems, then use the relevant measurements to plan a trial around your finished-product target.
How to Read the Texture Measurements
- Hardness
- Peak force during compression of the sample.
- Springiness
- Recovery of sample height or distance after compression, as defined by the test.
- Cohesiveness
- A ratio describing internal structural integrity across two compressions.
- Chewiness
- A calculated parameter combining hardness, cohesiveness and springiness.
Interpret the measurements against the food’s target. Instrumental values alone do not determine consumer preference.
Starch Blending Changed Gel Firmness
Fresh gels containing hydroxypropyl distarch phosphate (HDP). Percentages below describe HDP as a share of total starch.
- 15% total starch, dry basis; remaining rice:tapioca starch ratio 1:0.85.
- 80°C for 20 minutes, with stirring at 200 rpm; then 4°C for 3 hours.
- Samples conditioned to 25 ± 3°C; 40% compression, 1 mm/s test speed.
| HDP / total starch | Hardness (N) | Chewiness (N) |
|---|---|---|
| 0% HDP | 15.11 ± 0.49 | 10.79 ± 0.19 |
| 25% HDP | 14.32 ± 1.01 | 9.63 ± 0.26 |
| 50% HDP | 13.34 ± 0.95 | 8.97 ± 0.13 |
A softer gel in this formulationHigher HDP replacement corresponded to lower hardness and chewiness under these preparation and test conditions.
Starch Dosage Changed Protein-Gel Texture
Acetylated distarch adipate (ADA) in shrimp myofibrillar protein gel. Dosage is the starch-to-protein mass ratio.
- Protein concentration: 70 mg/mL in 50 mM phosphate buffer containing 0.1 M NaCl.
- 90°C water bath for 30 minutes, followed by an ice bath for 30 minutes and storage at 4°C before analysis.
- The dosage denominator is protein mass, rather than total food mass.
| ADA / protein | Hardness (g*) | Springiness |
|---|---|---|
| 0% ADA | 195.50 ± 14.61 | 0.87 ± 0.02 |
| 0.5% ADA | 349.74 ± 25.63 | 0.89 ± 0.05 |
| 1.0% ADA | 299.59 ± 28.89 | 0.93 ± 0.01 |
*g is the instrument-reported force unit. Springiness is dimensionless.
Balance more than one attributeAmong the groups shown, the highest hardness and highest springiness occurred at different dosages.
These model-system values illustrate texture evaluation; they are not Tianjiang grade specifications. The panels use different formulations, units and dosage bases. Assess each system separately and establish finished-product dosage through trials.
Confirm Performance in Your Own Product
| Evaluation stage | What to record | Comparison controls |
|---|---|---|
| After processing | Viscosity, shape, coating, spreading or piping | Complete formulation and consistent preparation |
| At serving temperature | Hardness, springiness, adhesiveness; sensory smoothness and pastiness | Same temperature, sample dimensions and method |
| During storage | Water separation, hardening, structural and sensory changes | Defined sampling times and storage conditions |
| After reheating or thawing | Consistency, structure and eating characteristics | Actual preparation and serving conditions |
Build a Practical Texture Trial
Make the target concrete, then compare candidates under consistent conditions.
Define the Target
Share a current sample, target sample or clear description: softer, easier to spread, less sticky or a firmer bite.
Screen Starches and Dosages
Include a control and compare candidate grades and doses. Record the complete formulation and processing conditions.
Validate Through Processing and Storage
Confirm the shortlisted option in actual processing, packaging, storage and serving conditions.
Texture Improvement FAQs
What Is the Difference Between Thickening and Texture Improvement?
Thickening describes an increase in resistance to flow. Texture evaluation also considers firmness, springiness, adhesiveness and eating characteristics. Choose measurements around how the food is prepared, served and eaten.
Can Modified Starch Help Reduce Pasty Mouthfeel?
A suitable grade, dosage and preparation method may help achieve the desired mouthfeel. Compare candidates in your complete recipe and use sensory evaluation to assess pastiness, stickiness and smoothness.
How Do I Choose Between E1422 and E1442?
Use your target texture, formulation, preparation, processing and storage conditions to shortlist specific grades. The E number identifies a modification category; it does not specify the performance of every grade.
Does a Higher Starch Dosage Always Improve Texture?
No. The preferred dosage depends on the food and the target. Hardness, springiness, flow and sensory acceptance can respond differently, so compare multiple attributes instead of maximizing a single value.
How Should Texture Be Evaluated During Storage?
Use consistent sample dimensions, measurement temperature, conditioning and instrument settings. Define sampling times, then compare instrumental readings with water separation, appearance and sensory observations.
What Information Is Needed for a Starch Recommendation?
Share your application, formulation, current starch and dosage, processing conditions, texture issue, target sample or description, storage requirements and serving temperature.
Let’s Build Your Target Texture
Tell us what your product feels like today—and what you want it to feel like. Share your formulation and processing conditions to discuss suitable starch candidates and a practical trial plan.
Prefer email? sales@tianjiangmodifiedstarch.com
Helpful Details for Your Enquiry
- Food type, formulation and current starch dosage
- Current issue and target texture
- Heating, mixing and shear conditions
- Storage method and required shelf life
- Serving temperature and sample needs
Start with the information you have.