
Modified Starch Solutions for Viscosity Stability
Keep your product’s consistency within its target range. Explore starch selection for viscosity control through processing, cooling and storage, matched to your formulation and measurement conditions.

Is Your Product’s Viscosity Changing Beyond the Target?
Locate the stage where consistency changes. Check both thinning and excessive thickening against the intended use.
Thinning After Processing
Check the point where flow becomes too fast or coating becomes insufficient. Compare samples before and after the relevant operation under the same test conditions.
Excessive Thickening After Cooling
A product that flows well when hot may be difficult to pour or fill after cooling. Define the cooling history, rest time and use temperature.
Viscosity Drift During Storage
Track gradual thinning or thickening over time. Include actual packaging, storage temperature and the complete formulation.
Inconsistent Batch Readings
Review sampling, temperature, instrument settings and sample handling when results differ between batches or operators.
Control Viscosity Across the Product Lifecycle
A useful comparison starts with a defined baseline and follows the product through the conditions that matter.
Establish the Required Starting Consistency
Specify the initial viscosity and test method. Confirm consistent starch dispersion, preparation and formulation before evaluating later change.
Evaluate Processing and Storage Separately
Record the result after processing, cooling and defined rest, then at planned storage intervals to identify where changes arise.
Compare Readings Under the Same Conditions
Control measurement temperature, spindle and speed or shear rate, read time and sample conditioning for comparable readings.
- 01Preparation
- 02Processing
- 03Cooling & rest
- 04Storage
- 05Final use
Applications Where Consistency Must Last
Evaluate the change that affects pouring, spooning, spreading or serving in each food system.
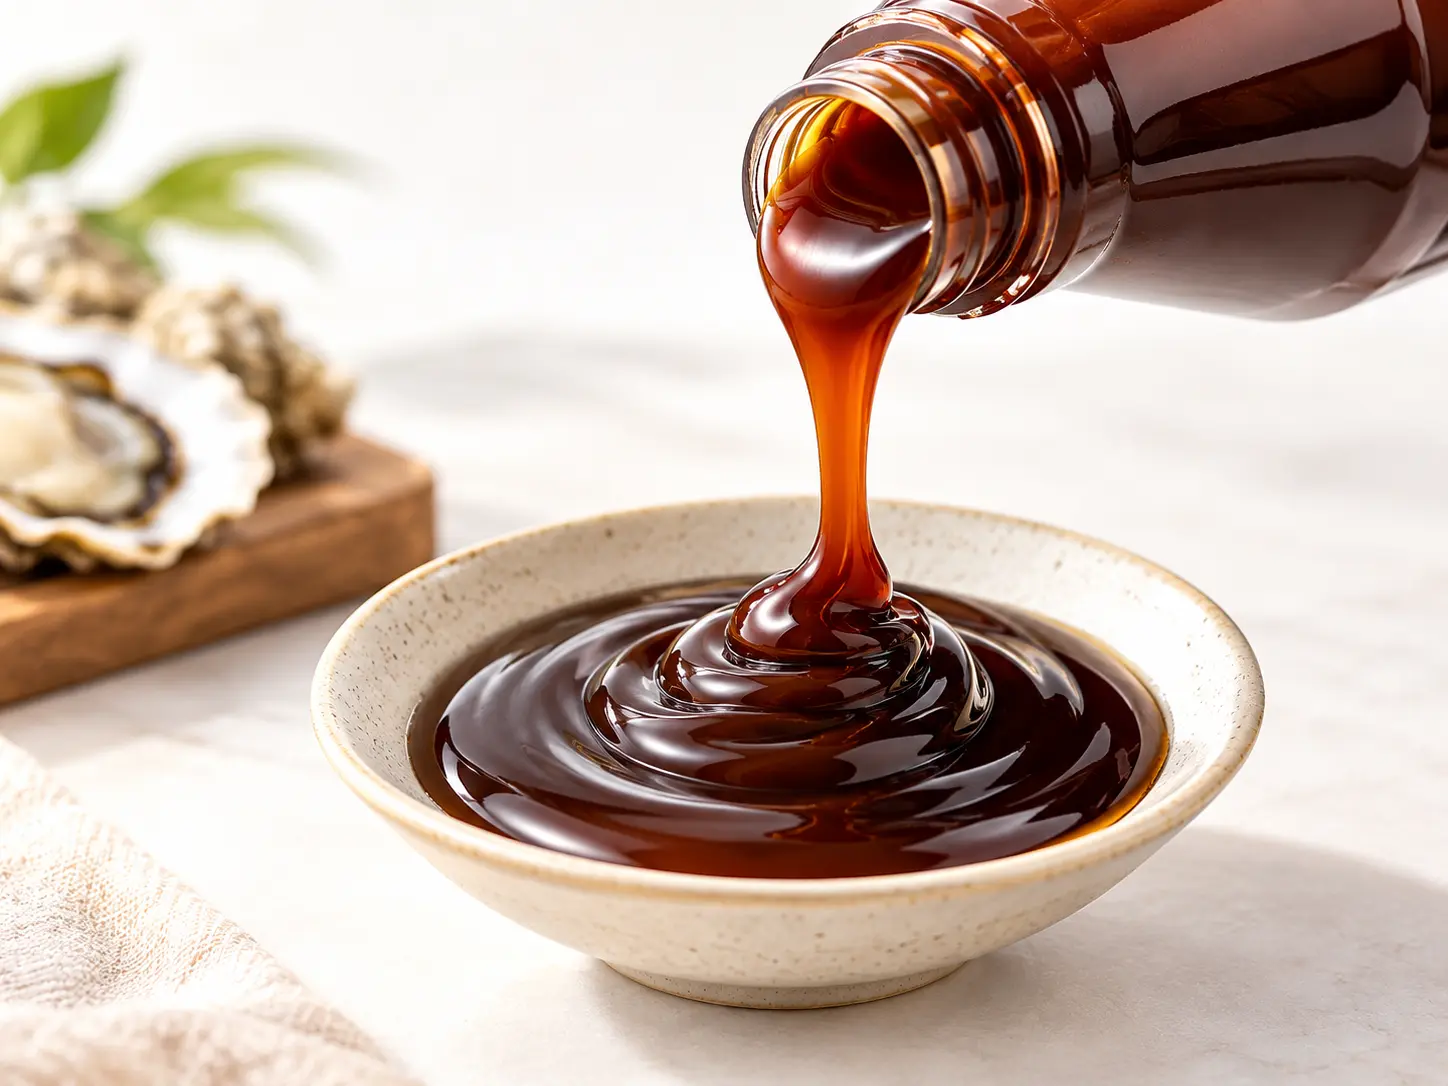
Bottled Savory Sauces
Compare pouring and coating after cooking, filling and storage. Use the complete sauce recipe and consistent measurement conditions.
Explore oyster sauce →
Chilled Stirred Yogurt
Track consistency after stirring and cooling, then during refrigeration. Check both viscosity readings and the desired spooning behavior.
Explore stirred yogurt →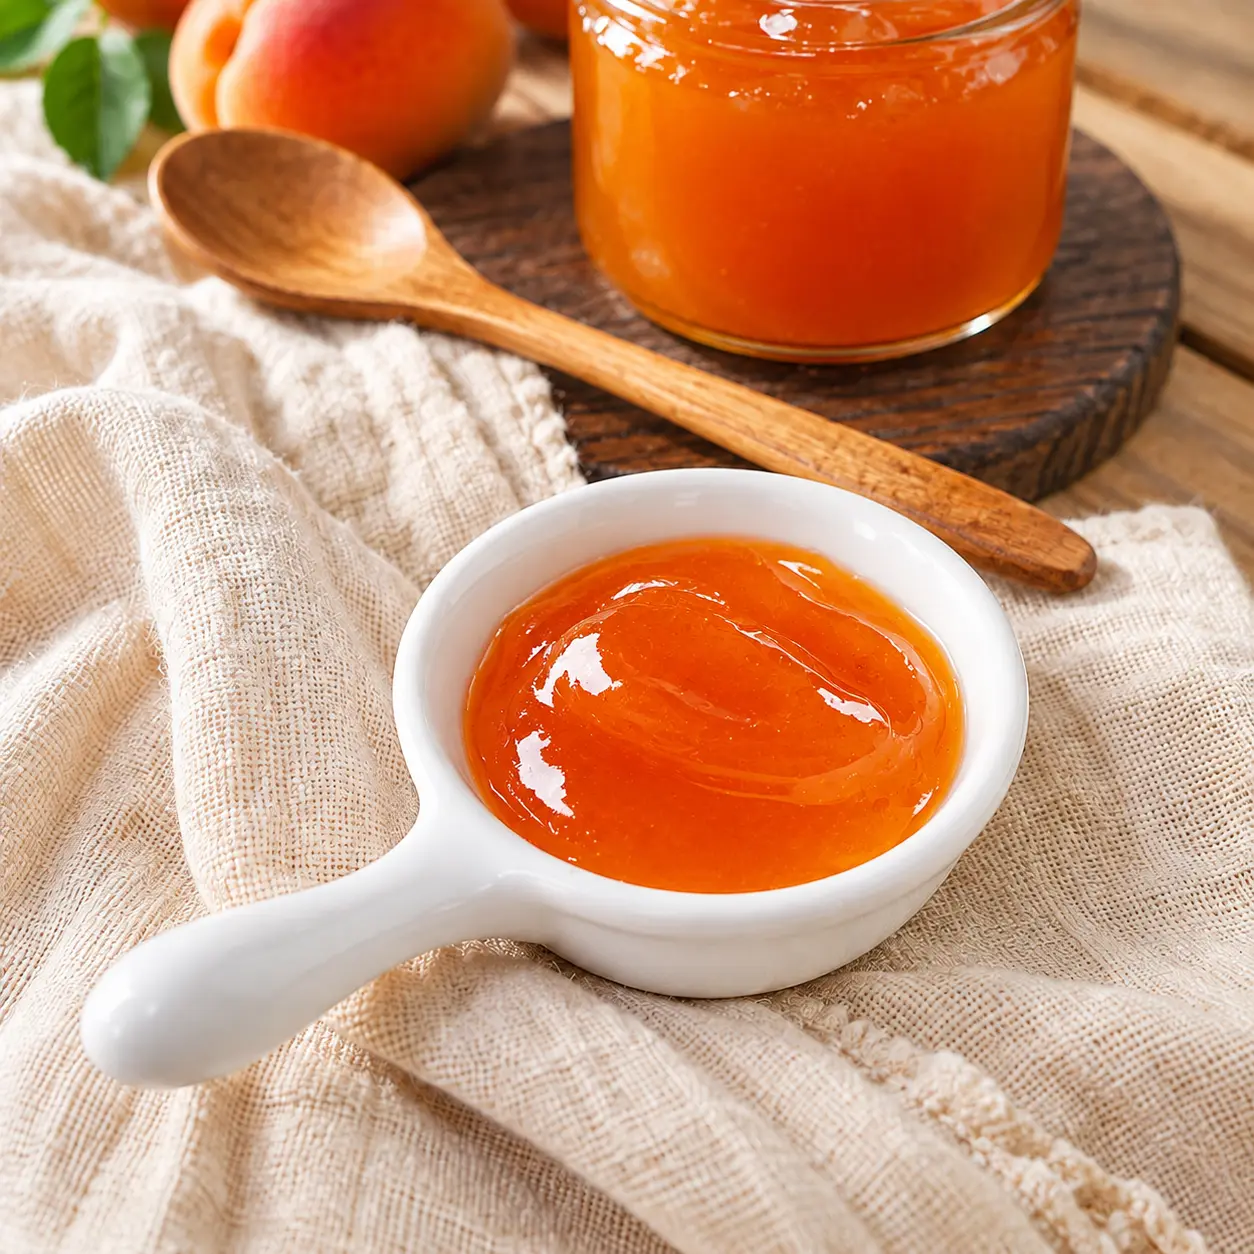
Fruit Fillings and Preparations
Assess spreading, piping and portioning after preparation and storage. Evaluate the complete fruit, sugar and acid system.
Explore fruit fillings →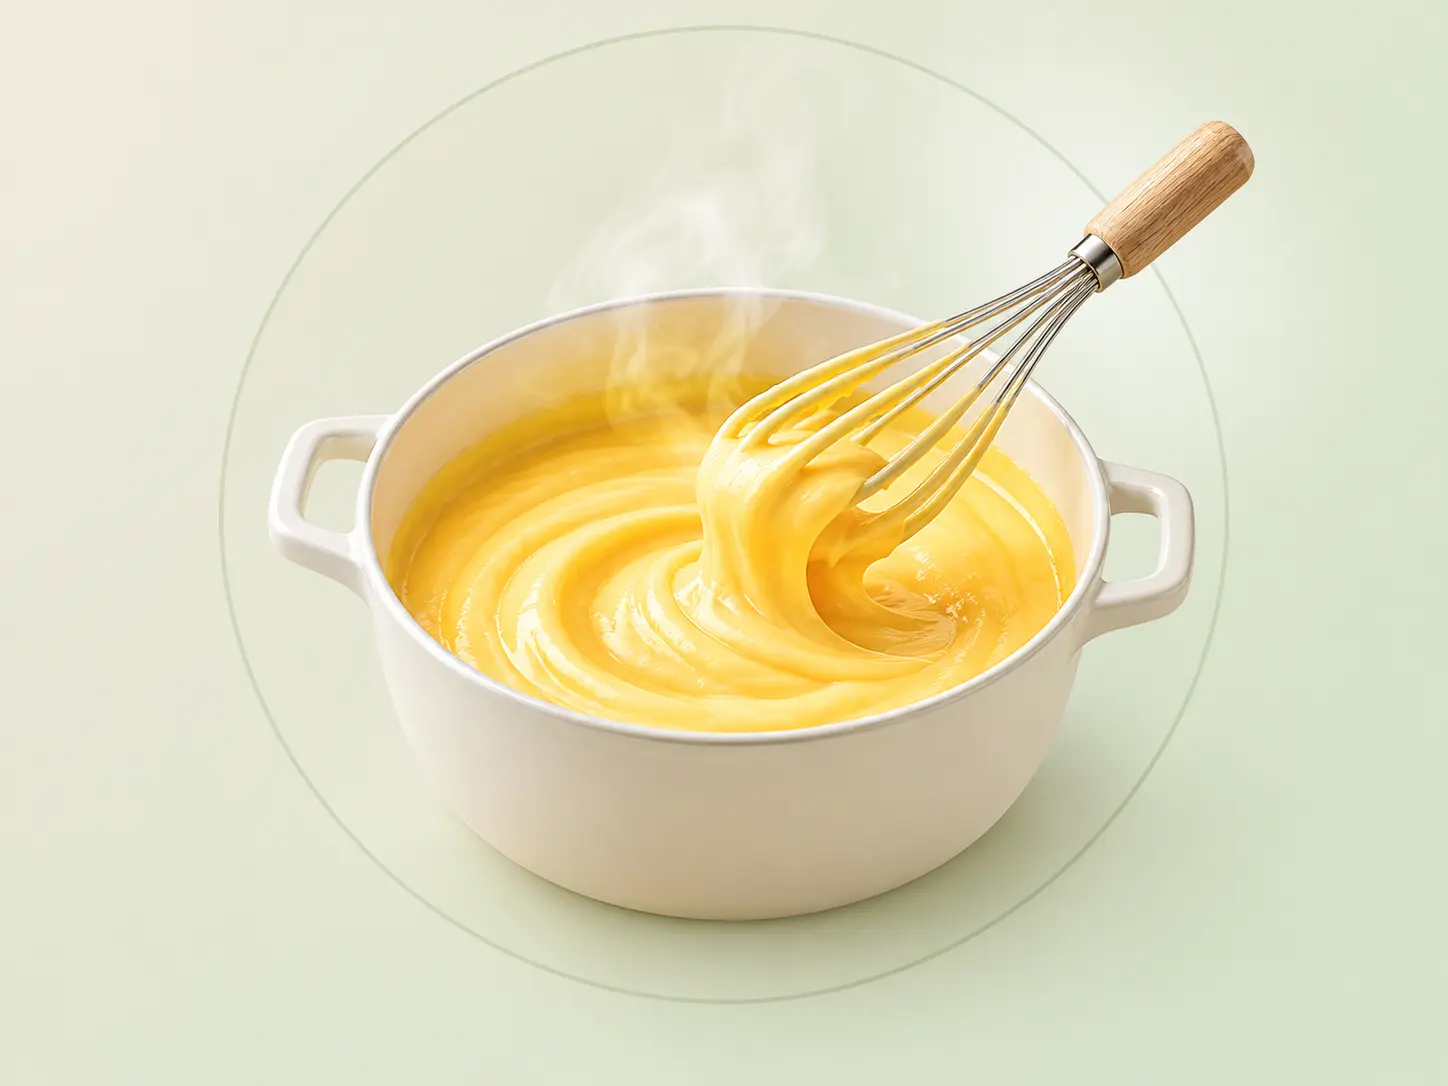
Heat-Processed Cream Sauces
Review flow after heating and mixing, after cooling and after relevant reheating. Confirm the result in the actual dairy and fat system.
Explore cheese sauce →Choose Starch Around Your Viscosity Stability Requirements
Use the target range, complete recipe and product history to define a grade comparison.
Define the Target Range and Test Conditions
| Selection factor | Information to share | Evaluation focus |
|---|---|---|
| Initial viscosity | Target range, reference sample and measurement method | A consistent starting state |
| Complete formulation | Water, sugar, salt, acid, fat and protein | Performance in the actual matrix |
| Starch preparation | Grade, dosage, dispersion and cooking or hydration | Preparation consistency |
| Processing | Temperature, time, mixing, pumping and homogenization | Change across relevant operations |
| Cooling and rest | Cooling history, final temperature and waiting time | Subsequent thickening or structural change |
| Storage | Duration, temperature, packaging and freeze-thaw exposure | Viscosity drift over time |
| Final use | Pouring, coating, piping, filling or reheating | Acceptable application performance |
Acetylated Distarch Adipate — E1422
Review specific grades against your recipe and processing conditions. Confirm the required consistency after processing and during storage.
Explore E1422 →Hydroxypropyl Distarch Phosphate — E1442
Compare specific grades for the target viscosity, cooling history and storage requirements of your application.
Explore E1442 →An E number does not specify uniform viscosity stability. Validate the specific grade and dosage in the complete recipe and actual process.
Tianjiang’s Guide to Viscosity Stability Evaluation
Compare defined time points and conditions. Read both increases and decreases against the product’s requirements.
Define the Baseline Before Comparing Stability
Hydroxypropyl distarch phosphate (HDP) thickened liquid models were prepared around an initial apparent-viscosity target of 300 ± 20 mPa·s. This is not an equal-dose thickening-efficiency comparison.
Brookfield DV2 T-RV, RV-2 spindle: reading 60 seconds after reaching 50 s⁻¹. Storage: 4°C for 28 days. Day 0 is the post-treatment baseline. Values are means ± standard deviations, n = 3.
Heating Time Changed Subsequent Viscosity Drift
| Thermal treatment | Day 0 (mPa·s) | Day 28 (mPa·s) |
|---|---|---|
| 80°C · 3 min | 378.5 ± 0.98 | 331.0 ± 15.29 |
| 80°C · 6 min | 366.8 ± 19.79 | 374.8 ± 7.20 |
Follow each treatment through storageThe two treatments produced different subsequent changes in this model. Neither hold time is a universal optimum.
The Fluid Base Changed Storage Behavior
| Fluid base | Day 0 (mPa·s) | Day 28 (mPa·s) |
|---|---|---|
| Distilled water | 340.1 ± 16.81 | 406.8 ± 11.68 |
| Sports drink | 366.8 ± 19.79 | 374.8 ± 7.20 |
| Orange-flavored base | 288.4 ± 5.46 | 284.6 ± 4.77 |
The sports drink row is the same six-minute group shown in Comparison A. The orange-flavored base is the beverage model, rather than a puree or sauce.
Evaluate the complete matrixThe direction and magnitude of change differed across the fluid bases.
These model-system results guide trial design; they are not Tianjiang grade specifications or predictions of finished-food shelf life. Set the product’s baseline, measurement conditions and acceptance range before comparing candidates.
Measure Change Against Your Own Acceptance Range
(Later viscosity − baseline viscosity) ÷ baseline viscosity × 100
Later viscosity ÷ baseline viscosity × 100
Use a positive, non-zero baseline and comparable test conditions. Retention above 100% indicates thickening; it does not automatically indicate better stability. Read the initial and final values alongside the direction of change and application performance.
Confirm Performance in the Actual Product
| Evaluation stage | Information to record |
|---|---|
| After preparation | Recipe, starch grade, dosage and initial product state |
| After processing | Temperature, time, equipment and sampling location |
| After cooling and rest | Test temperature, conditioning time and viscosity |
| During storage | Viscosity, water separation and appearance at defined sampling times |
| At final use | Pouring, coating, spreading, piping or reheating performance |
Build a Practical Viscosity Stability Trial
Set the acceptance range, compare candidates and track the actual product through its lifecycle.
Set the Target and Acceptance Range
Specify the baseline stage, starting viscosity, final-use requirements and acceptable degree of change.
Compare Grades Through the Actual Process
Include a control and record each candidate after processing, cooling and defined rest.
Track Performance During Storage
Set sampling times for the actual packaging and storage route. Combine readings with application checks.
Viscosity Stability FAQs
What Is the Difference Between Thickening and Viscosity Stability?
Thickening establishes the required product body. Viscosity stability describes how well the product stays within its target consistency range through defined processing, cooling, rest and storage conditions.
Does Higher Viscosity Mean Better Stability?
No. A product can become too thick or too thin for its use. Compare starting and final readings, the direction of change and the acceptable range for pouring, filling or eating.
Why Can Viscosity Increase During Storage?
Starch structure, continued hydration and interactions within the complete formulation can change during storage. Evaluate these effects alongside temperature, time and other ingredients in the actual product.
How Should Viscosity Retention Be Calculated?
Divide the later reading by the defined baseline reading and multiply by 100. Use comparable measurement conditions and report the baseline stage. Retention above 100% indicates an increase in viscosity and does not automatically indicate a better result.
Can Measurements at Different Temperatures Be Compared?
They can describe product behavior at different temperatures, but they do not isolate structural change. To assess change through processing or storage, condition samples to the same test temperature and use the same settings.
What Information Is Needed for a Starch Recommendation?
Share the complete formulation, current starch and dosage, initial and later viscosity readings, the measurement method, processing history, the stage where change occurs and storage requirements.
Let’s Keep Your Consistency on Target
Tell us when and how your product’s viscosity changes. Share your formulation, processing conditions and target range to discuss suitable starch candidates and a practical evaluation plan.
Prefer email? sales@tianjiangmodifiedstarch.com
Helpful Details for Your Enquiry
- Food type, complete recipe, current starch and dosage
- Initial and later viscosity readings
- Test method and target range
- Processing conditions and where the change occurs
- Storage, packaging and serving requirements
Start with the information you have.